Concept · Equine data · 2026
Thoroughbase
A mobile-first virtual barn that turns a racehorse’s RFID chip into one complete, permission-aware record.
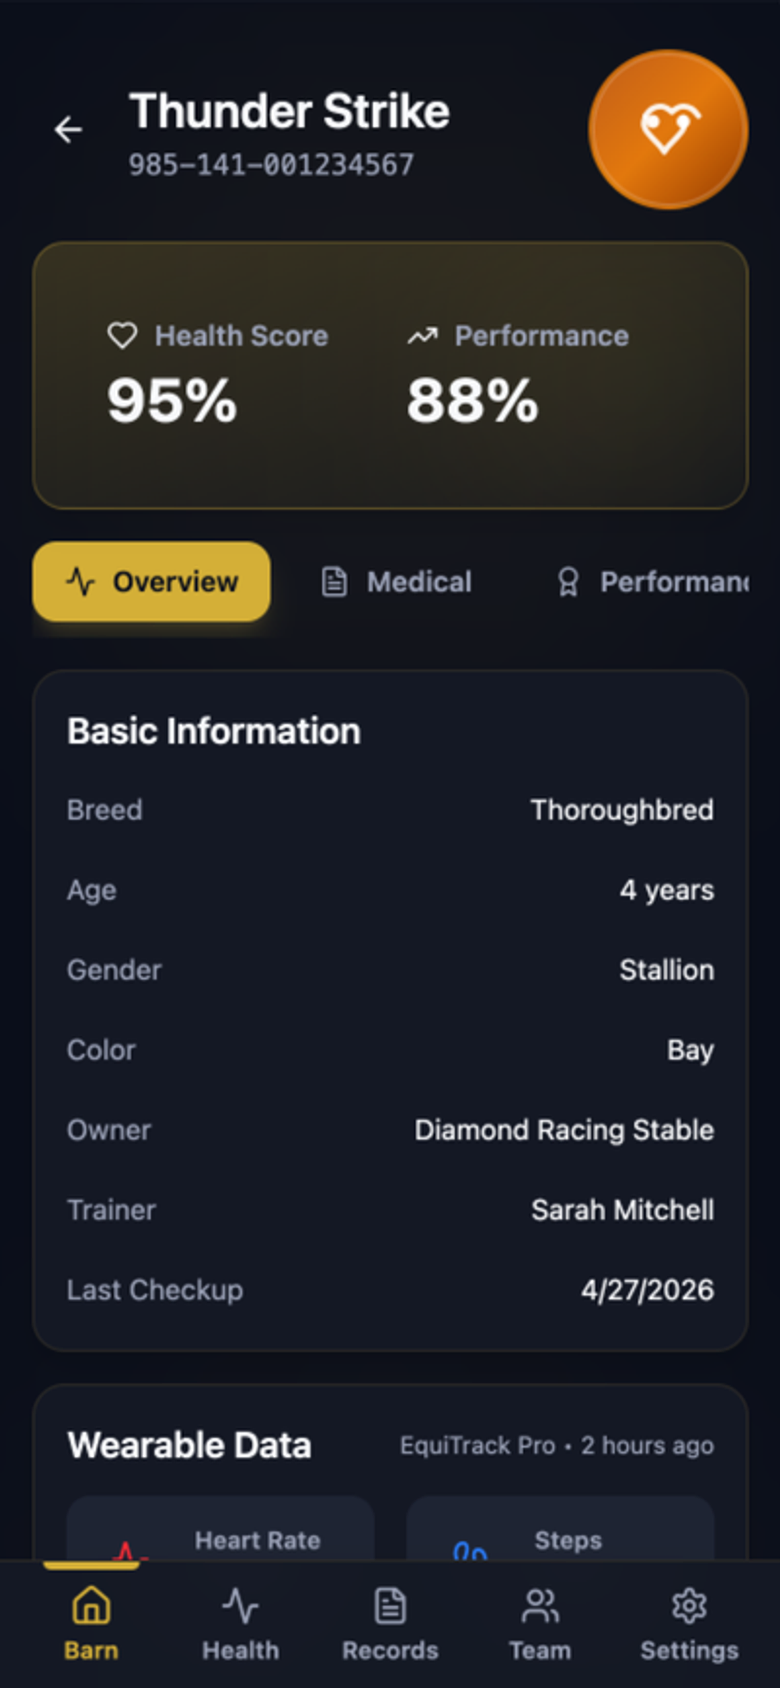
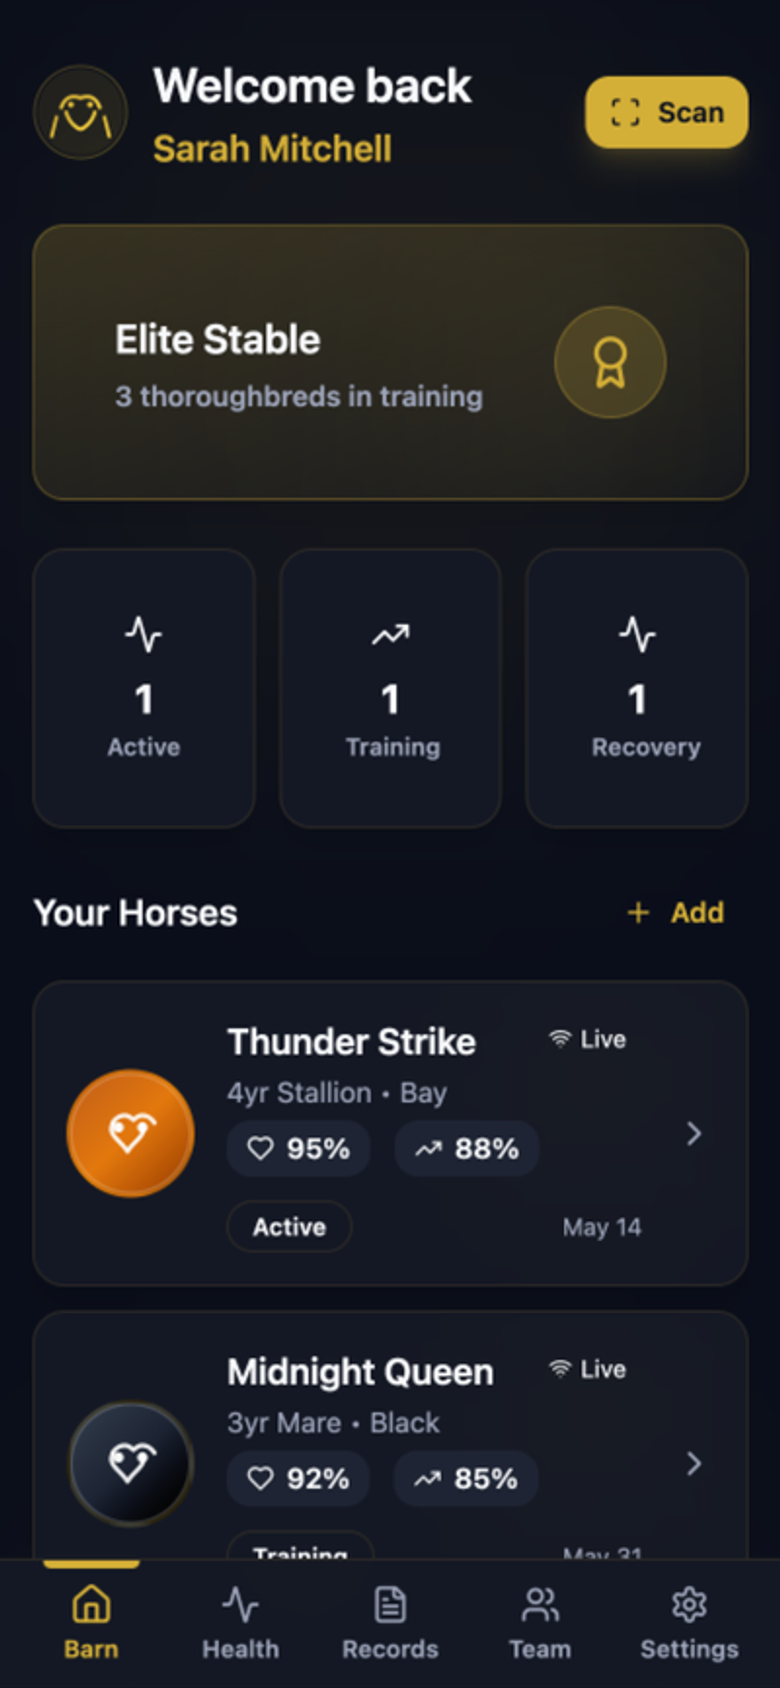
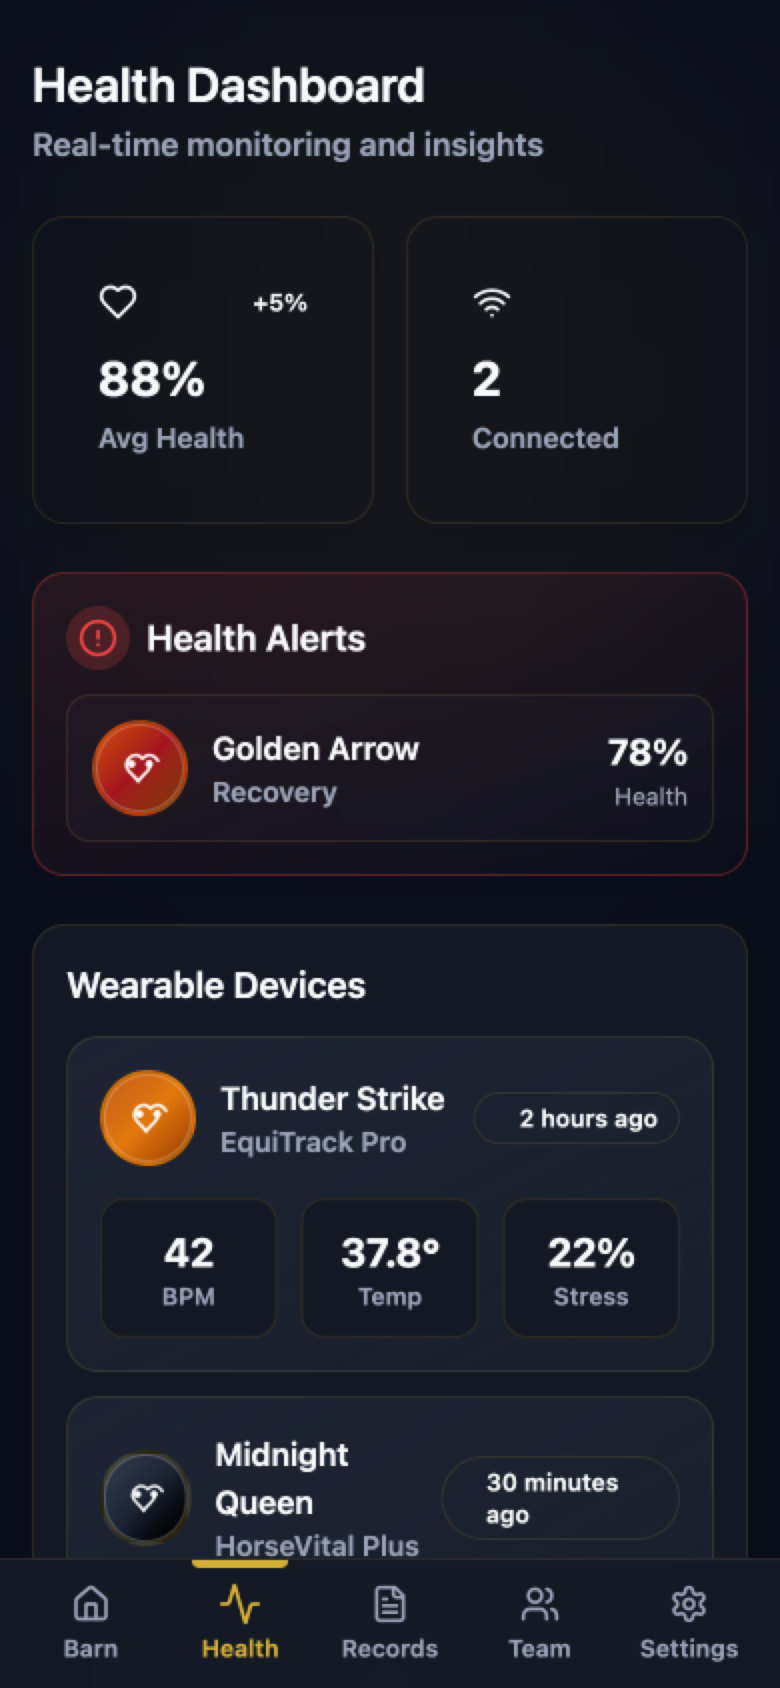
01
Overview
A thoroughbred racehorse generates a remarkable amount of data: vet visits, X-rays, race results, bloodlines, treatment plans and, more and more, live readings from RFID chips and wearable sensors. Today that information is scattered across paper files, vet portals, track systems and third-party apps, and the people who care for a horse each need a different slice of it.
Thoroughbase is a concept for a mobile-first “virtual barn.” It links everything known about a horse to the RFID chip already implanted in its neck, pulls in wearable data automatically, and shows owners, trainers, managers and foremen only what’s relevant to their role.
About this project. Thoroughbase is a self-initiated concept. I wrote the product brief and generated the interactive prototype with Figma Make. The research below covers the desk research, stakeholder mapping and heuristic review I’ve done, plus the plan I’d use to validate the concept with real barn teams. Personas are assumption-based proto-personas, clearly marked as hypotheses to test.
02
The challenge
How might we give everyone in a racing barn one trustworthy source of truth for each horse, without overwhelming them or exposing data they shouldn’t see?
Three tensions shaped the problem from day one:
- Completeness vs. focus. The goal is to hold all of a horse’s information, but a foreman at 5 a.m. needs one or two things, fast.
- Connected vs. private. Integrating chips and wearables makes data effortless to capture, and makes permissions essential. Medical and financial records are sensitive.
- Serious vs. delightful. The brief asked for something that feels “almost like a game, where the horse is the sim,” while still handling medical history with the gravity it deserves.
03
Objectives
One living record per horse: medical history, X-rays, performance and accolades, pedigree and breeding, treatment and maintenance plans, and notes.
Use the horse’s RFID chip as its key, and bring wearable data into one dashboard so readings flow in instead of being re-keyed.
Role-based profiles and assignable permissions for owners and partners, trainers, managers and foremen, so sensitive data stays with the right people.
Make daily check-ins glanceable and rewarding, “caring for your sim,” so the app is used every day, not just at vet visits. Cool and premium, not cartoonish.
04
Research approach
Because this began as a concept, I front-loaded the research I could do without a client, and designed the studies I’d run next with real barn teams.
- Desk research. How RFID and wearables are used in racing today, and what data already exists for each horse.
- Stakeholder & role mapping. Who touches a horse’s data, what each role needs, and what they should never see.
- Proto-personas & jobs-to-be-done. Assumption-based personas for the four core roles, to make the hypotheses explicit and testable.
- Prototype & heuristic review. Generate a working prototype with Figma Make, then evaluate it against usability heuristics.
- Validation plan. Field studies and usability tests with trainers, foremen, managers and owners to confirm or kill each assumption.
05
What desk research told me
RFID in horse racing typically works on two layers:
- Passive microchips implanted in the horse’s neck carry a unique ID.
- Active sensors on equipment, such as saddle cloths, track identification, speed, position and safety metrics.
Readers placed around a track enable precise automated timing, fraud prevention and real-time monitoring of 40+ horses at once. Meanwhile, a growing category of equine wearables works like a fitness tracker for horses, capturing heart rate, temperature, activity and recovery.
The opportunity wasn’t a lack of data. It was the lack of one place, organized around the horse, that ties these streams together. That became the core of the concept:
one recordThoroughbase
06
Who uses it
Mapping the roles in a barn turned a vague “permissions” requirement into a concrete access model. This matrix became the backbone of the Team screen.
| Data | Owner / partner | Trainer | Manager | Foreman |
|---|---|---|---|---|
| Horse profile & status | Full | Full | View all | Assigned horses |
| Medical records & X-rays | Full | Edit | View | Status only |
| Treatment plans | Full | Manage | View | Update daily progress |
| Performance & race history | Full | Full | Reports | — |
| Schedules | View | Edit | Manage | View assigned |
| Financial records | Full | — | — | — |
| Team & permissions | Admin | — | — | — |
Proto-personas
These are hypotheses, not research findings. Each one names an assumption I’d validate in the field.
Sarah, the trainer
Juggles training plans, vet guidance and race prep for every horse in her care.
Needs: health and performance trends at a glance; fast access to the latest treatment note.
Assumption to test: trainers will check the app between sets during morning works.
Michael, the owner
Invested in several horses and wants confidence that they’re healthy and progressing.
Needs: race results, earnings, costs and a clear health summary.
Assumption to test: owners care most about performance and spend, and less about daily logs.
Jessica, the barn manager
Keeps schedules, staff and records running across the whole barn.
Needs: a view of every horse, scheduling and exportable reports.
Assumption to test: reporting is a weekly task, so it can live a level deeper.
Marcus, the foreman
Hands-on with assigned horses all day, often with gloves on and little time.
Needs: scan a horse, see today’s tasks, log status in seconds.
Assumption to test: foremen will scan before they search, and need big, simple controls.
Jobs to be done
- When a horse comes in from morning works, I want to log how it went in seconds, so the trainer sees it before deciding on afternoon care.
- When the vet updates a treatment plan, I want everyone assigned to that horse to see the change, so no one follows yesterday’s instructions.
- When I scan an unfamiliar horse, I want its identity and current status confirmed instantly, so I know I have the right animal.
- When I’m reviewing my investment, I want performance and health in one summary, so I can make decisions without chasing updates.
07
Design principles
The horse is the hero
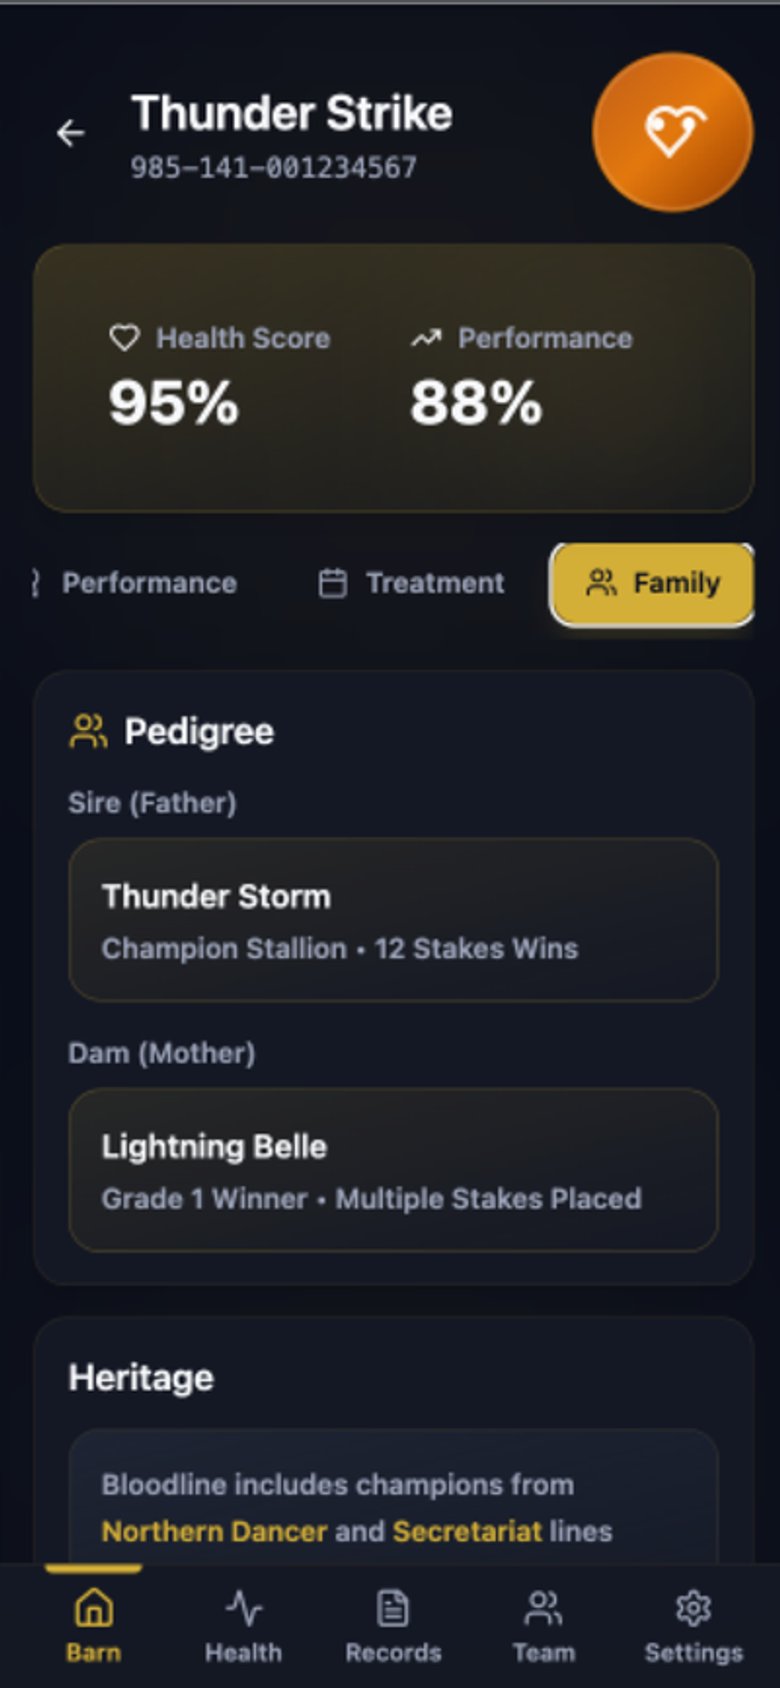
Every screen starts from a horse, like a character in a sim: a profile, live vitals, history and a family tree.
Right data, right person
Permissions shape the interface itself, so each role sees a focused version of the same truth.
Glanceable first
Scores, status chips and live indicators up top; detail one tap away. Built for one hand, outdoors.
Premium & calm
A dark, gold-accented palette that feels like race day, keeps glare down in early mornings, and treats medical data seriously.
08
The prototype
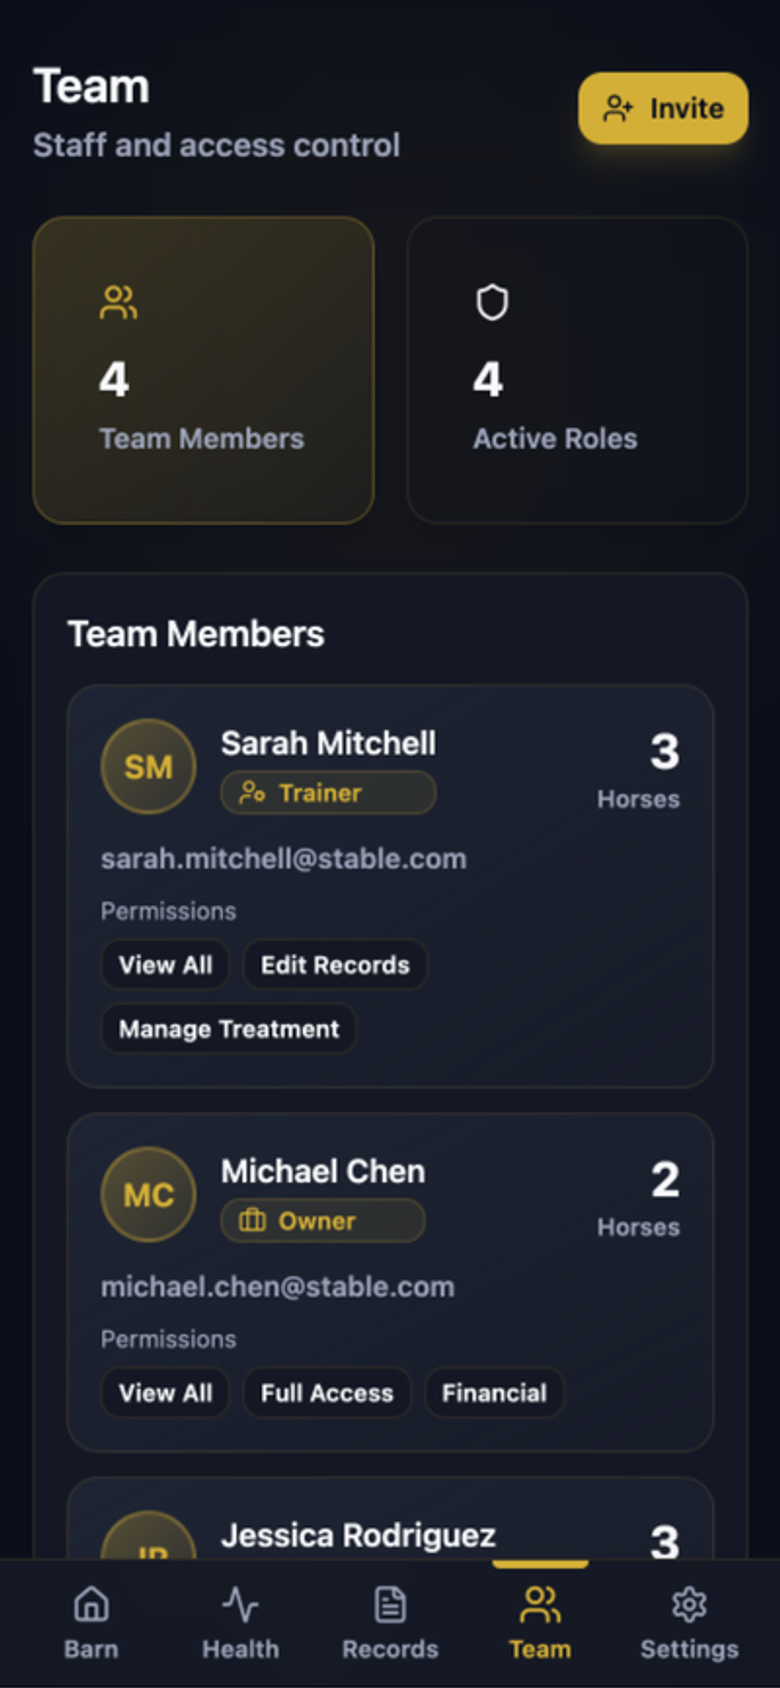
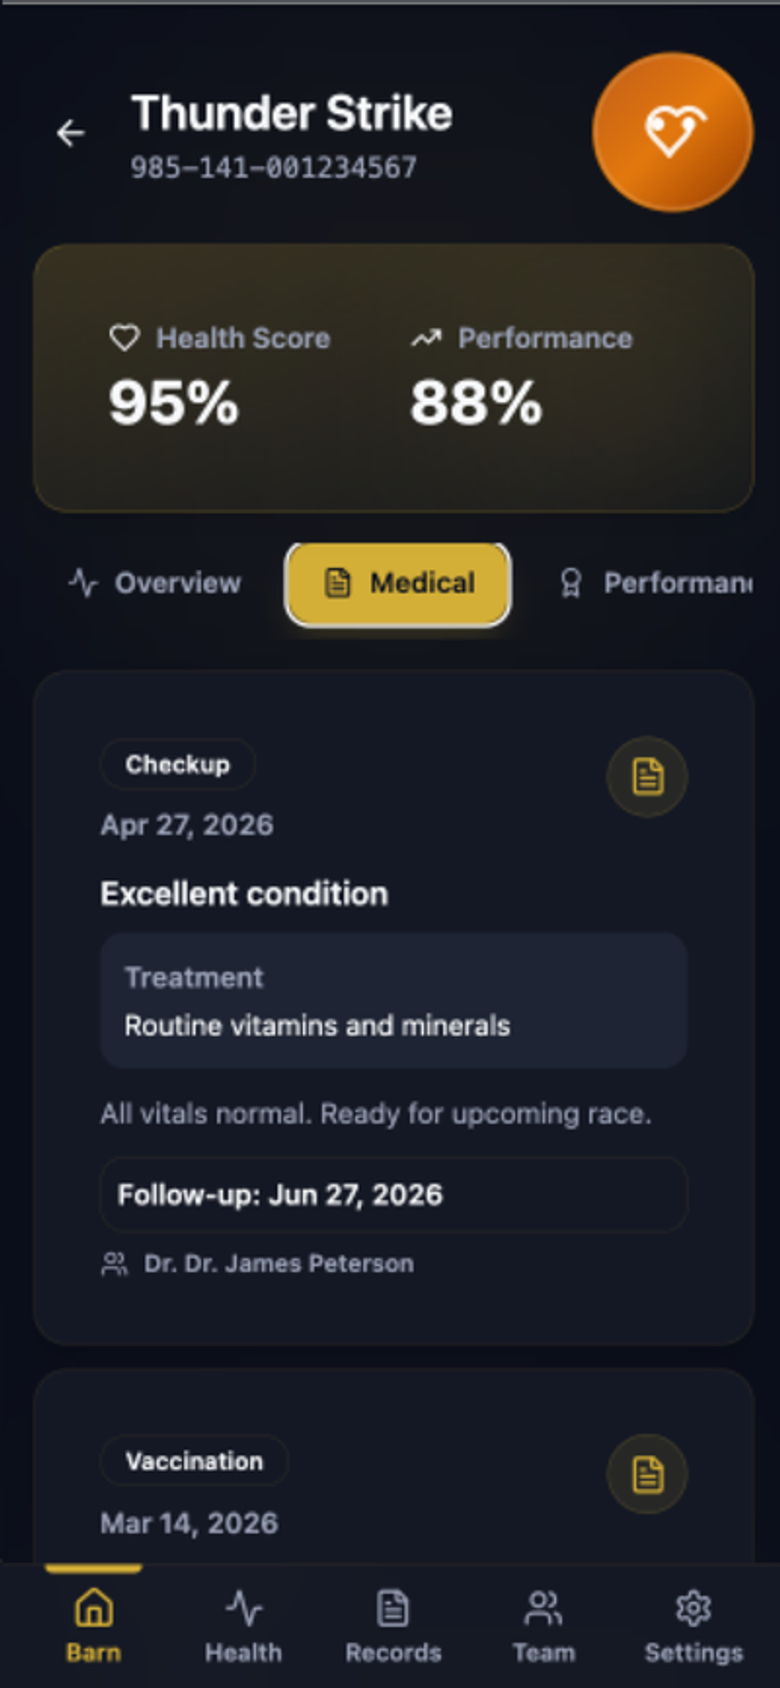
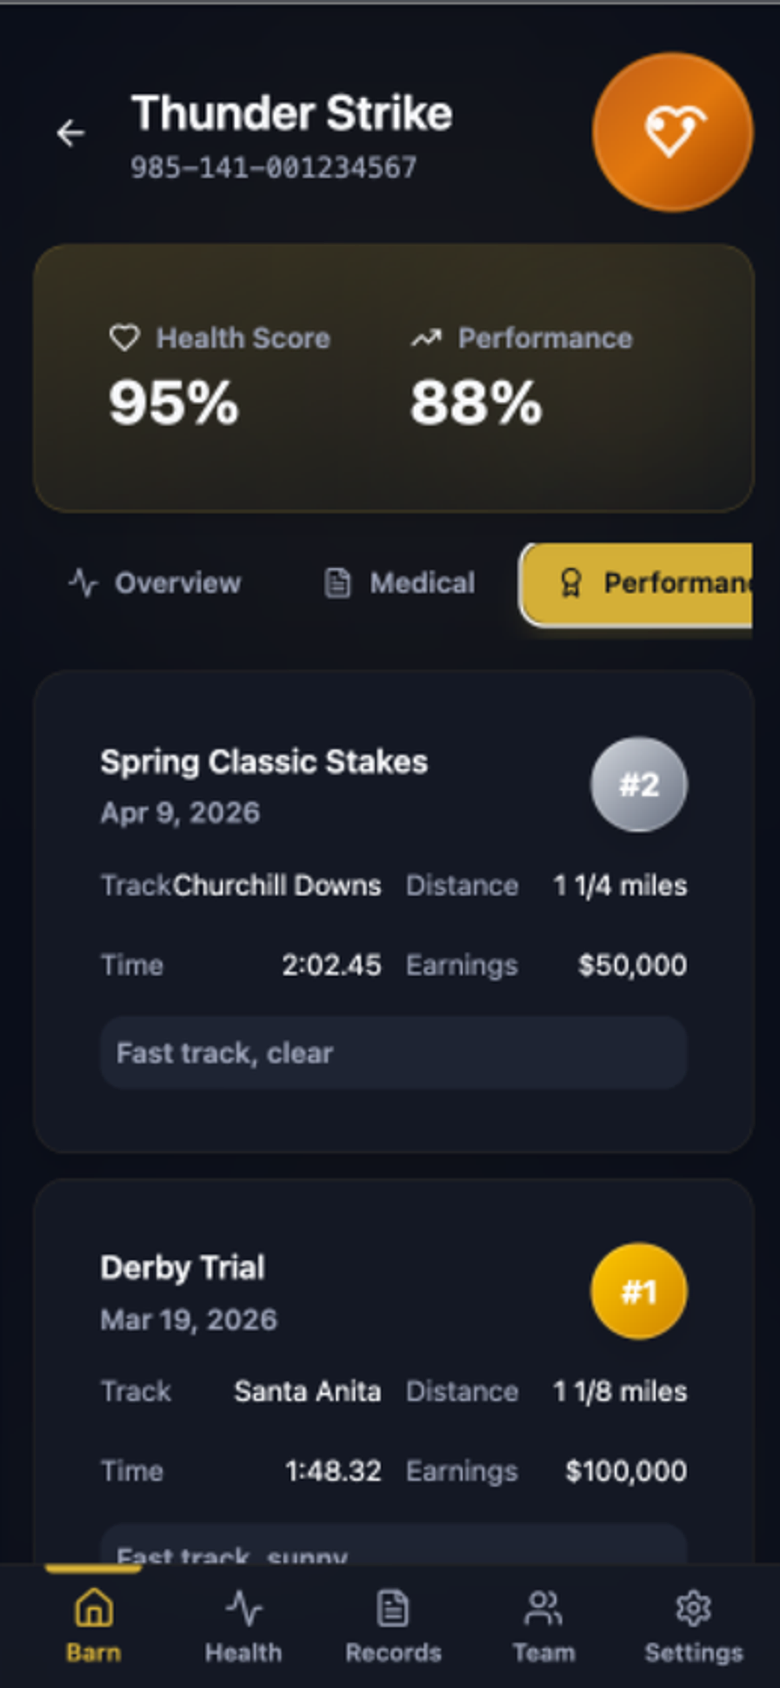
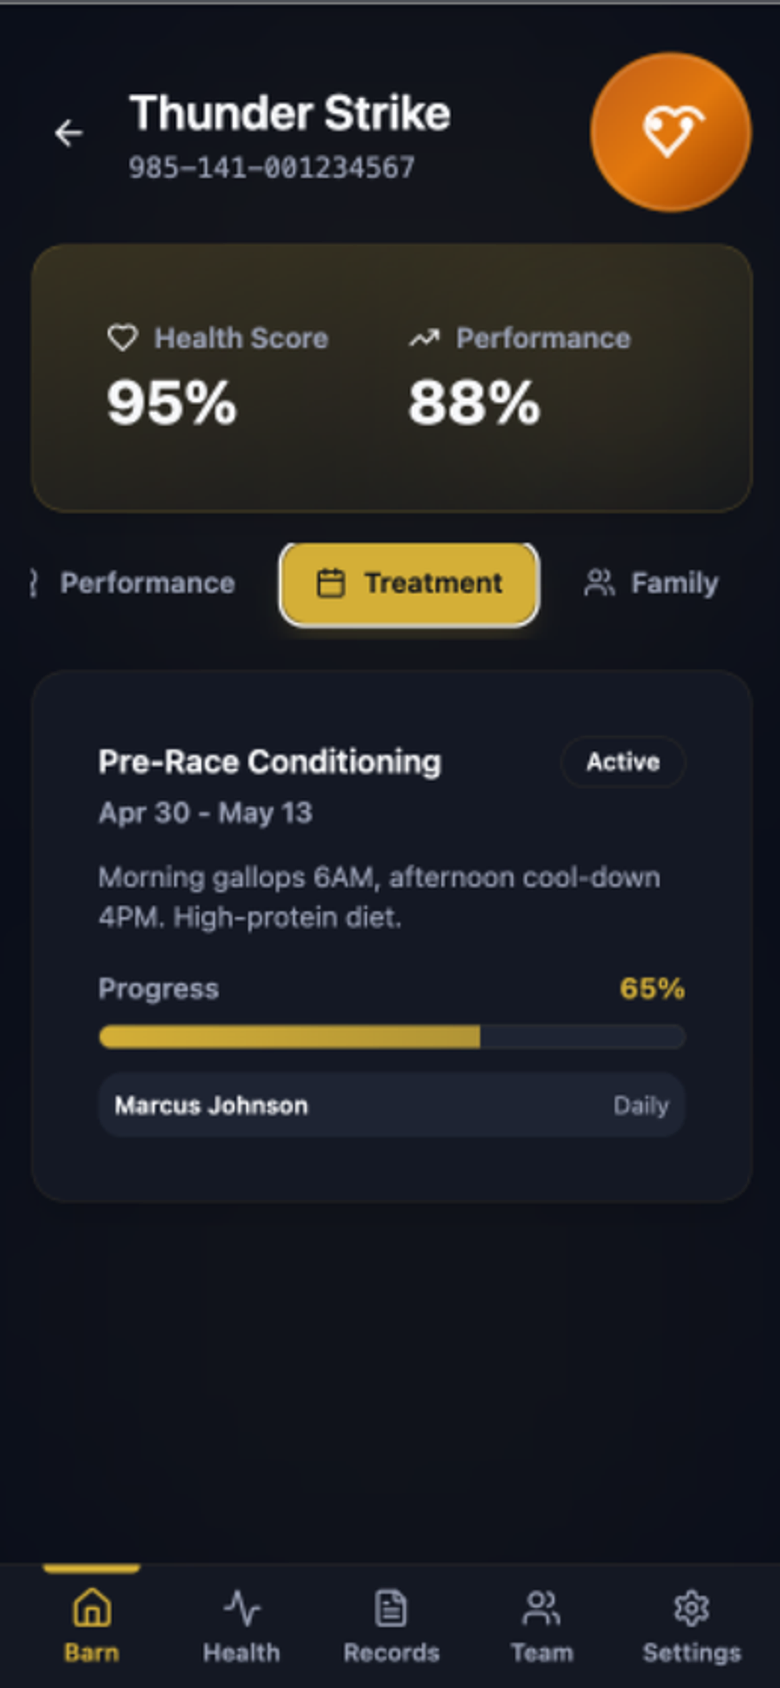
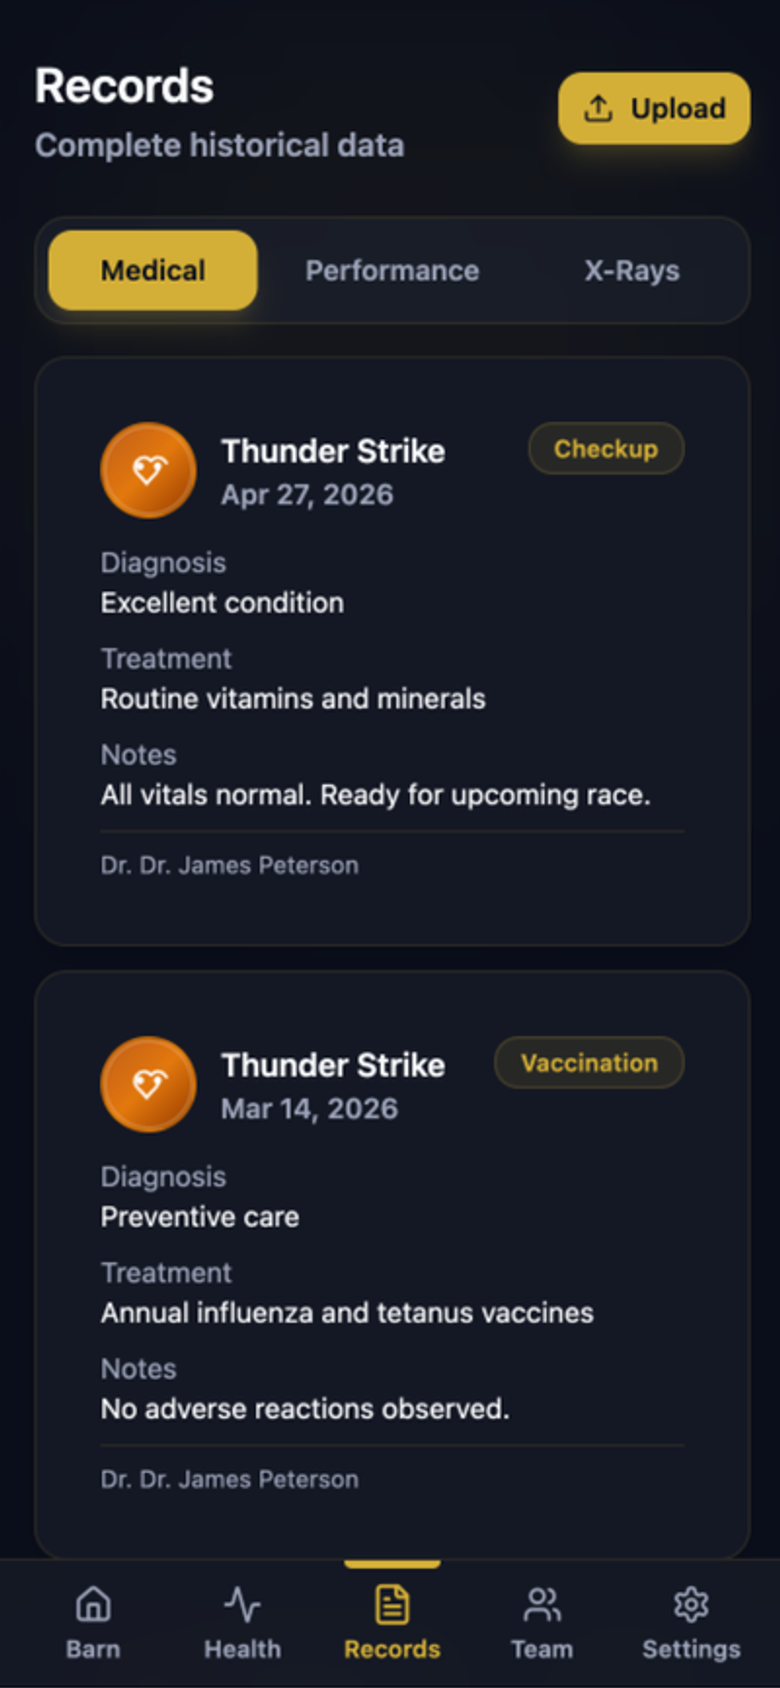
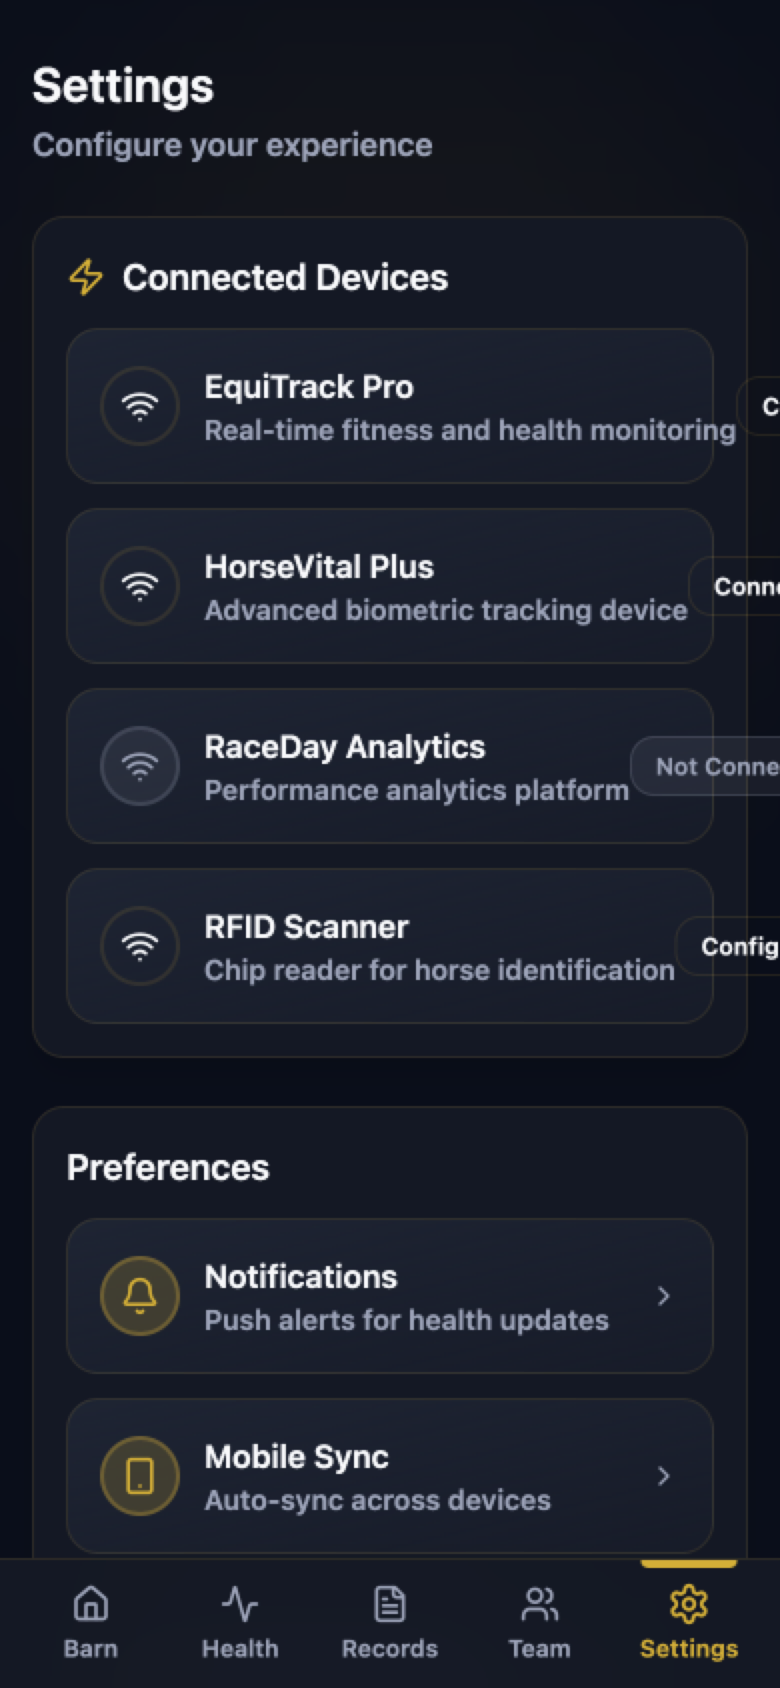
I turned the brief into a high-fidelity, mobile-first prototype with Figma Make, then explored it screen by screen. Partner device names in the prototype, like EquiTrack Pro and HorseVital Plus, are placeholders.
09
Heuristic review: what I’d fix next
AI gets you to a testable artifact fast, but it doesn’t do the judgment for you. I reviewed the generated prototype against Nielsen’s usability heuristics. These issues are real, and they set the agenda for the next iteration.
| Finding | Heuristic | Next iteration |
|---|---|---|
| Scan, the hero action, opens a placeholder alert instead of a scanning flow | Visibility of system status | Design the full flow: scanning state, haptic confirmation, “horse found” card, manual search fallback and an unregistered-chip error |
| Device status labels (Connected / Not Connected / Configured) are clipped off the edge of the Settings screen | Visibility of system status | Move status under each device name as a labeled chip that wraps safely |
| Vet names render as “Dr. Dr. James Peterson” | Consistency & error prevention | Store titles separately from names and format them in one place |
| Health and performance appear as bare percentages | Match between system & real world | Explain what drives each score, show the trend, and link to the underlying readings |
| Permissions are visible on the Team screen but not editable | User control & freedom | Add an edit-permissions sheet with presets per role and a clear review step |
| Small gold text on dark surfaces | Accessibility | Audit every text and icon pair against WCAG AA and adjust tokens where needed |
10
Validation plan
The next step is getting this in front of the people who’d use it. Each study maps back to an assumption above.
Contextual inquiry
Observe morning works and evening rounds at two or three barns to see how information is captured and shared today, and where it gets lost.
Card sort
Have trainers, managers and vets sort record types to validate the Records taxonomy and the horse-profile tabs.
Task-based usability tests
Scan a horse and confirm its identity; log a treatment update; invite a foreman with limited access; find the latest X-ray.
Diary study
A week with foremen logging daily status, to test whether quick, game-like check-ins hold up in real barn conditions.
Success measures I’d track
These are targets to validate, not results:
- Time from scan to the right horse’s profile: about 3 seconds
- Foreman logs daily status in under 30 seconds
- Trainers find the latest treatment note in one tap from the horse profile
- Zero permission leaks across role-based test scenarios
- Daily active use by barn staff, not just at vet visits
11
Reflection
Thoroughbase let me practice the part of UX I love most: turning an ambitious brief into clear, testable bets. AI prototyping got me from idea to an interactive app in a fraction of the usual time. That speed is only valuable if research decides what’s worth building, so the real work starts with listening to the people in the barn.